
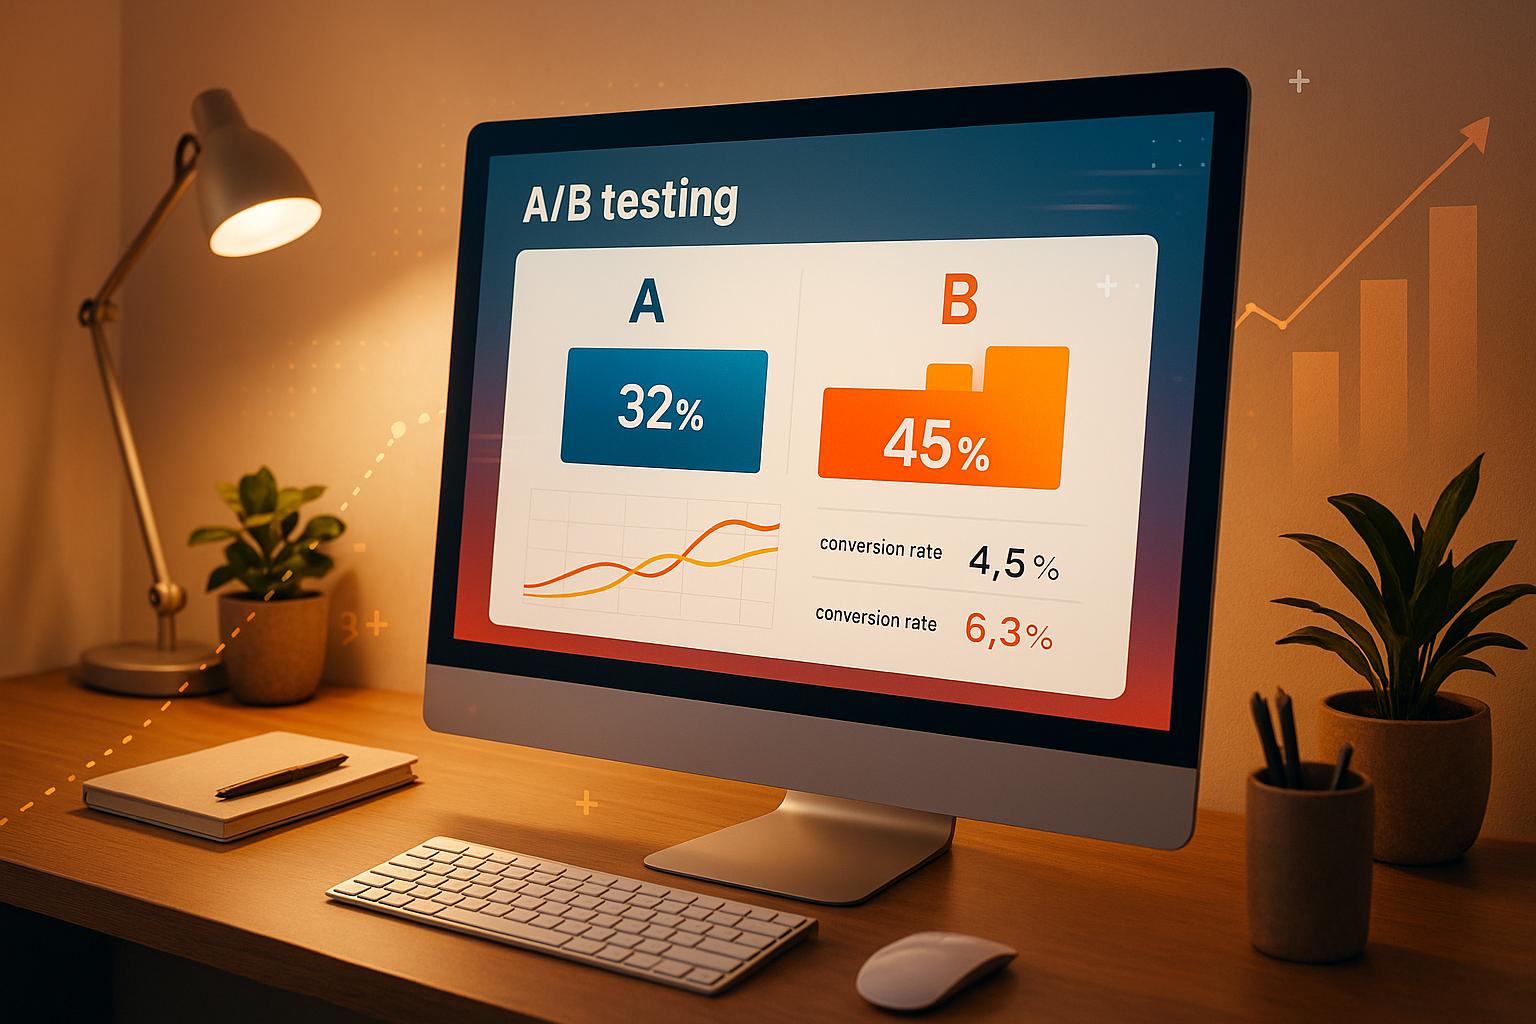
A/B testing is the best way to improve your paywall without risking your revenue or user experience. By comparing two versions of your paywall, you can make decisions based on real user behavior instead of guesswork. Here’s what you need to know:
- Why A/B Test Paywalls? It helps you find the right balance between boosting subscriptions and keeping users engaged. Publishers have seen conversion rates grow by up to 400% after testing pricing, messaging, or free article limits.
- What to Test: Focus on one variable at a time, like pricing, messaging, or design. Testing multiple changes at once can lead to unclear results.
- How to Plan: Set clear goals, like increasing subscriptions by 15%, and ensure you have enough traffic for reliable results. Use tools like Lideroo to simplify testing and track performance.
- Running the Test: Split traffic evenly (e.g., 50/50) or cautiously (e.g., 80/20) between versions. Run tests for 2-6 weeks, depending on the variable.
- Key Metrics: Monitor conversion rates, average revenue per user (ARPU), churn rates, and engagement to measure success.
Start small, analyze results, and roll out the winning version gradually to minimize risks. Keep testing regularly to improve your paywall over time.
A/B testing and Optimization for Paywalls - CRO & Experimentation
Planning Your Paywall A/B Test
Careful planning is the backbone of a successful A/B test. Without a solid plan, your results might be unreliable or difficult to act on. Here's how to lay the groundwork before diving into paywall testing.
Setting Clear Goals and Hypotheses
Start by defining exactly what you want to achieve. Common goals for paywall A/B testing include increasing subscription rates, boosting revenue, improving user retention, or enhancing engagement metrics[7].
Your objectives should be specific and measurable. For example, you might aim to increase monthly subscription revenue by 15% or improve free-to-paid conversion rates by 2 percentage points. From there, craft a hypothesis that ties a particular paywall change to an expected outcome. For instance, you could hypothesize that reducing the number of free articles from 5 to 3 will lead to a 10% increase in conversions.
The key here is to base your hypothesis on actual user behavior or past performance data - not guesswork. Clear goals and a well-thought-out hypothesis will guide your technical setup and help you interpret results with confidence.
Meeting Technical Requirements
A successful A/B test depends on having the right tools and infrastructure in place. You’ll need adequate traffic, analytics tools to track user behavior, and a way to segment users based on factors like location, device type, or usage patterns[1][7].
To ensure statistical validity, calculate the minimum sample size you'll need. This calculation should factor in your current conversion rates, desired confidence level (usually 95%), and the smallest effect size you want to detect.
Platforms like Lideroo make this process much simpler. With built-in monetization tools, user management features, and integrated analytics, Lideroo provides everything you need to run statistically valid tests. Its drag-and-drop editor and no-code setup allow you to quickly test different paywall designs, messaging, or pricing models - even if you lack technical expertise.
Recording Current Performance
Before making any changes, take time to document your baseline metrics. These will serve as your reference point for evaluating the success of your test.
Track key performance indicators like conversion rates, revenue per user, engagement levels, and churn rates over a specific period. Make sure to note any external factors - such as promotional campaigns or seasonal trends - that could influence your results. This detailed baseline data will help ensure that any observed improvements can be attributed to the paywall changes you’re testing.
Creating Your Paywall A/B Test
With your planning and baseline performance completed, it’s time to design a test that provides clear, actionable insights.
Choosing What to Test
The next step is to identify the single most impactful element to test. This is a core principle of paywall A/B testing: focus on one variable at a time. Testing multiple changes at once, like altering both the background image and pricing, can lead to "confusing results", making it impossible to pinpoint which change influenced user behavior[3].
Key elements to consider testing include:
- Pricing strategy
- Messaging and headlines
- The number of free articles allowed before the paywall activates
- Design elements like background images
- Device-specific targeting[1]
These areas often yield the largest changes in conversions. In fact, data suggests that systematically testing major paywall components can boost conversion rates by an average of 400% per test[1]. A great starting point is pricing, as it directly affects revenue, followed by messaging and paywall placement.
For instance, if you test only a background image, you’ll gain clear insights into which visual resonates most with users. But if you simultaneously test the background, product layout, and pricing, you won’t know which change drove the results[3].
| Paywall Element | Testing Options |
|---|---|
| Header Area | Banners, sliders, videos |
| Copy | Headings, subheads, features, benefits |
| Products | Different pricing plans and subscription lengths |
| Offers | Discounts, trials |
| Call-to-Action Button | Button text, color, placement |
| Footer Area | Consent checkboxes, links to terms and privacy policy |
Splitting Your Traffic
The standard method for A/B testing is to divide your traffic 50/50 between the control paywall (Variant A) and the test paywall (Variant B)[5][4]. This ensures a balanced comparison and provides reliable data.
That said, you can adjust the traffic split based on your risk tolerance. For example, if you’re concerned about potential revenue loss from a new variation, start by sending only 10–20% of traffic to the new variant while keeping 80–90% on the current paywall[2]. This cautious approach allows you to monitor early results before scaling up.
- Variant A: The control group, representing your current paywall setup.
- Variant B: The test group, featuring the specific changes you’re evaluating[4].
Random traffic allocation is crucial for maintaining fairness in the comparison[5].
Geographic differences can also significantly impact paywall performance. For instance, one publisher conducted a "Stubbornness" test to determine the optimal number of paywall prompts before users subscribed. The results varied widely by region, highlighting that what works in the U.S. might not perform as well elsewhere[1].
Using Lideroo for Test Setup

Once your traffic is divided, the right tools can streamline your test setup. Lideroo, an AI-powered, no-code website builder, offers features that simplify paywall optimization. With its drag-and-drop editor, customizable templates, and built-in monetization tools - like premium content options and subscription plans - Lideroo makes it easy to create and test different paywall designs.
You can duplicate existing pages or subscription modules to craft distinct paywall versions. Lideroo’s integrated analytics then tracks user engagement and conversion rates, helping you refine elements like layout, messaging, or pricing without needing complex technical expertise. While it doesn’t have automated A/B testing features specifically for paywalls, its intuitive platform provides a strong foundation for iterative improvements, setting the stage for successful test execution.
sbb-itb-dfa823a
Running Your A/B Test
Once your paywalls are live, it’s time to kick off your A/B test. Before diving in, make sure tracking is properly set up and the test is ready to go. From there, it’s all about planning the right duration and ensuring you have a large enough sample size to get meaningful results.
Starting the Test
Launch both test variants and note the exact start time. Double-check that tracking is working correctly for both versions before moving forward - this step is critical for accurate results.
Here’s a golden rule: don’t make any other changes to your site during the test. If technical issues pop up, pause the test, fix the problem, and restart. This helps ensure clean, reliable data.
Setting Test Length and Sample Size
The length of your test matters. To account for natural fluctuations in user behavior, run your test for at least 2–3 weeks. Depending on what you’re testing, you may need more time. Here’s a quick guide:
| Testing Parameter | Recommended Duration | Why It Matters |
|---|---|---|
| Pricing Tiers | 4–6 weeks | Revenue patterns need time to stabilize across billing cycles. |
| Content Access Limits | 2–3 weeks | User engagement trends appear quickly. |
| Payment Options | 3–4 weeks | Conversion behavior varies by payment choice. |
| Messaging Variations | 1–2 weeks | Click-through rates respond almost immediately. |
For statistical significance, use an online calculator that factors in your baseline conversion rate and expected improvement. If your site has low traffic - fewer than 1,000 unique visitors a week - consider extending the test to 4–6 weeks to gather enough data for clear conclusions.
Once you’ve nailed down the timeline and sample size, shift your focus to tracking key performance metrics in real time.
Monitoring Key Metrics
With the test underway, keep a close eye on these metrics to measure performance: conversion rate, average revenue per user (ARPU), churn rate, and user engagement.
- Conversion rate reveals which variant attracts more subscriptions.
- ARPU highlights the financial impact of your changes.
- Churn rate shows how well you’re retaining customers over time.
- Engagement metrics give insight into how users interact with your content, helping you gauge retention potential.
Look for consistent patterns over several days rather than relying on a single data point. Automated monitoring tools can help you catch issues early and reduce the risk of manual errors.
If you’re using Lideroo’s analytics dashboard, you’re in luck - it simplifies tracking trends and spotting anomalies across your paywall variants. This means you won’t need to juggle multiple platforms. Keep an eye out for sudden drops in traffic or conversions, as these could signal technical problems that need immediate attention.
Using Your Test Results
Your A/B test is done, and now it’s time to turn those results into actionable steps to improve your paywall’s performance.
Reading Your Data
Start by comparing the key metrics from your control and test groups. Pay close attention to conversion rate (the percentage of users who subscribe), revenue per visitor (total revenue divided by unique visitors), churn rate (the percentage of subscribers who cancel), and average order value. These metrics should tie back to your original hypothesis and align with your business objectives.
Make sure your results are statistically significant (p < 0.05) to confidently validate your hypothesis. For instance, if your test involved changing the number of free articles and the variant resulted in a 20% higher conversion rate with statistical significance, you can be confident this isn’t just a fluke.
However, don’t stop at a single metric. Look at the broader picture. For example, a variant might show an 18% increase in conversions but also a 7% rise in churn, which could hurt your long-term revenue[7]. Tracking multiple metrics over time ensures you understand the full impact of your changes.
Once you’ve analyzed the data and identified the most effective variant, you’re ready to implement it.
Rolling Out the Winner
After determining the winning variant, deploy it across your entire audience. But don’t just set it and forget it - keep monitoring key metrics to ensure the performance holds steady.
Watch for any unexpected issues, such as an increase in customer complaints or negative feedback. Sometimes, a paywall that works well in a small test group might create friction when applied to a larger audience. Be prepared to roll back the changes if problems arise.
To minimize risks, consider a gradual rollout. Instead of flipping the switch for 100% of your traffic all at once, start with a smaller portion - say 25% in the first week, then 50%, and so on. This phased approach allows you to catch and address potential issues early, reducing any revenue disruptions.
Continuing to Test and Improve
Your A/B test might have produced a winner, but that’s not the end of the road - it’s just the beginning. Continuous testing is key to adapting to changing market conditions and driving long-term growth.
Use your current results to guide your next experiment. For example, if reducing free articles from five to three boosted subscriptions by 20%, you could test whether allowing two free articles performs even better. Alternatively, you might explore whether different limits work better for specific user segments[1].
Iterative testing builds momentum over time. Publishers who consistently experiment with their paywalls have reported conversion rate gains of up to 400% over several months. This highlights the value of ongoing optimization[1].
If you’re using Lideroo’s analytics tools, setting up new tests is simple. The platform’s visual reporting and user segmentation features make it easy to spot opportunities and implement changes without juggling multiple systems.
To stay organized, maintain a testing calendar. This helps you avoid overlapping experiments and ensures you’re always learning. Focus on testing one variable at a time - whether it’s pricing, messaging, or payment methods - to achieve steady revenue growth through targeted paywall optimization.
Key Points for Paywall A/B Testing Success
To run successful paywall A/B tests, it's essential to use the right tools and focus on testing one variable at a time - whether that's pricing, messaging, or content limits. Publishers who stick to this method often see noticeable improvements in conversion rates after months of consistent, iterative testing [1].
Make sure your results are statistically reliable, with a significance level of p < 0.05. This usually means running tests for several weeks. Pricing tests, for instance, may require 4–6 weeks, while messaging tweaks often yield meaningful insights in just 1–2 weeks [6]. Another factor to consider is how you allocate traffic during testing.
For clean, straightforward data, a 50/50 traffic split works best. However, if you're cautious about revenue impacts, testing new variants with a smaller split - like 10–20% - can be a safer bet. Whatever split you choose, consistency throughout the test is crucial [2][8].
It's not just about tracking conversion rates. Keep an eye on other key metrics such as ARPU (average revenue per user), time on site, and subscriber retention. These figures help ensure that short-term gains don't lead to long-term issues.
For those who find A/B testing too complex, technology can make it more manageable. For example, Lideroo offers a no-code platform with drag-and-drop tools and built-in analytics, tailored for directory sites and blogs targeting U.S. audiences. This can simplify paywall testing and optimization, even for non-technical users.
To avoid confusion and ensure repeatable success, assign unique IDs to each test variant and document all testing details thoroughly [6].
One common mistake is viewing A/B testing as a one-off task. Paywall optimization works best as a continuous process. Maintaining a testing calendar helps you adapt to shifts in user behavior and market trends. This ongoing experimentation builds on the planning and analysis strategies discussed earlier, ensuring your approach evolves over time.
FAQs
How can I make sure my A/B test results for paywall performance are accurate and meaningful?
To get reliable and meaningful results from your A/B tests, start by setting clear goals and identifying the key metrics you’ll measure, like conversion rates or revenue per user. These metrics will guide your analysis and help you focus on what truly matters.
Make sure your sample size is large enough to minimize the effects of random variations. A small sample can lead to misleading results, so aim for a group size that accurately reflects your user base.
Run your test for at least 1-2 weeks to capture fluctuations in user behavior across different days and times. This ensures your data accounts for patterns like weekday versus weekend activity. Once the test concludes, use statistical tools to analyze the results. Calculate significance and confidence levels to confirm that any differences you see aren’t just due to chance.
By sticking to these practices, you can gather actionable insights and make better decisions to improve your paywall’s performance.
What are common mistakes to avoid when running A/B tests on paywalls, and how can I prevent them?
When running A/B tests on paywalls, there are a few common mistakes you’ll want to steer clear of. These include using a sample size that’s too small, testing multiple variables simultaneously, and jumping to conclusions before the data is fully baked. To sidestep these issues, make sure your test runs long enough to collect statistically significant results, focus on just one variable at a time - like pricing or messaging - and avoid the temptation to cut the test short.
It’s also important to watch out for external factors, like seasonality, that could skew user behavior during the testing period. By planning carefully and keeping a close eye on these details, you can gather dependable insights to fine-tune your paywall and improve its performance.
What paywall element should I test first to improve subscription rates effectively?
When aiming to boost your subscription rates, start by experimenting with key elements that shape user decisions. These might include your pricing model, the duration of your free trial, or how you present your value proposition. To get clear and actionable insights, focus on testing one variable at a time.
For instance, you could compare the effectiveness of a 7-day free trial versus a 14-day trial or try out different headline options that emphasize the top benefits of subscribing. By concentrating on these highly visible factors, you can quickly pinpoint changes that lead to the biggest impact on conversions.