
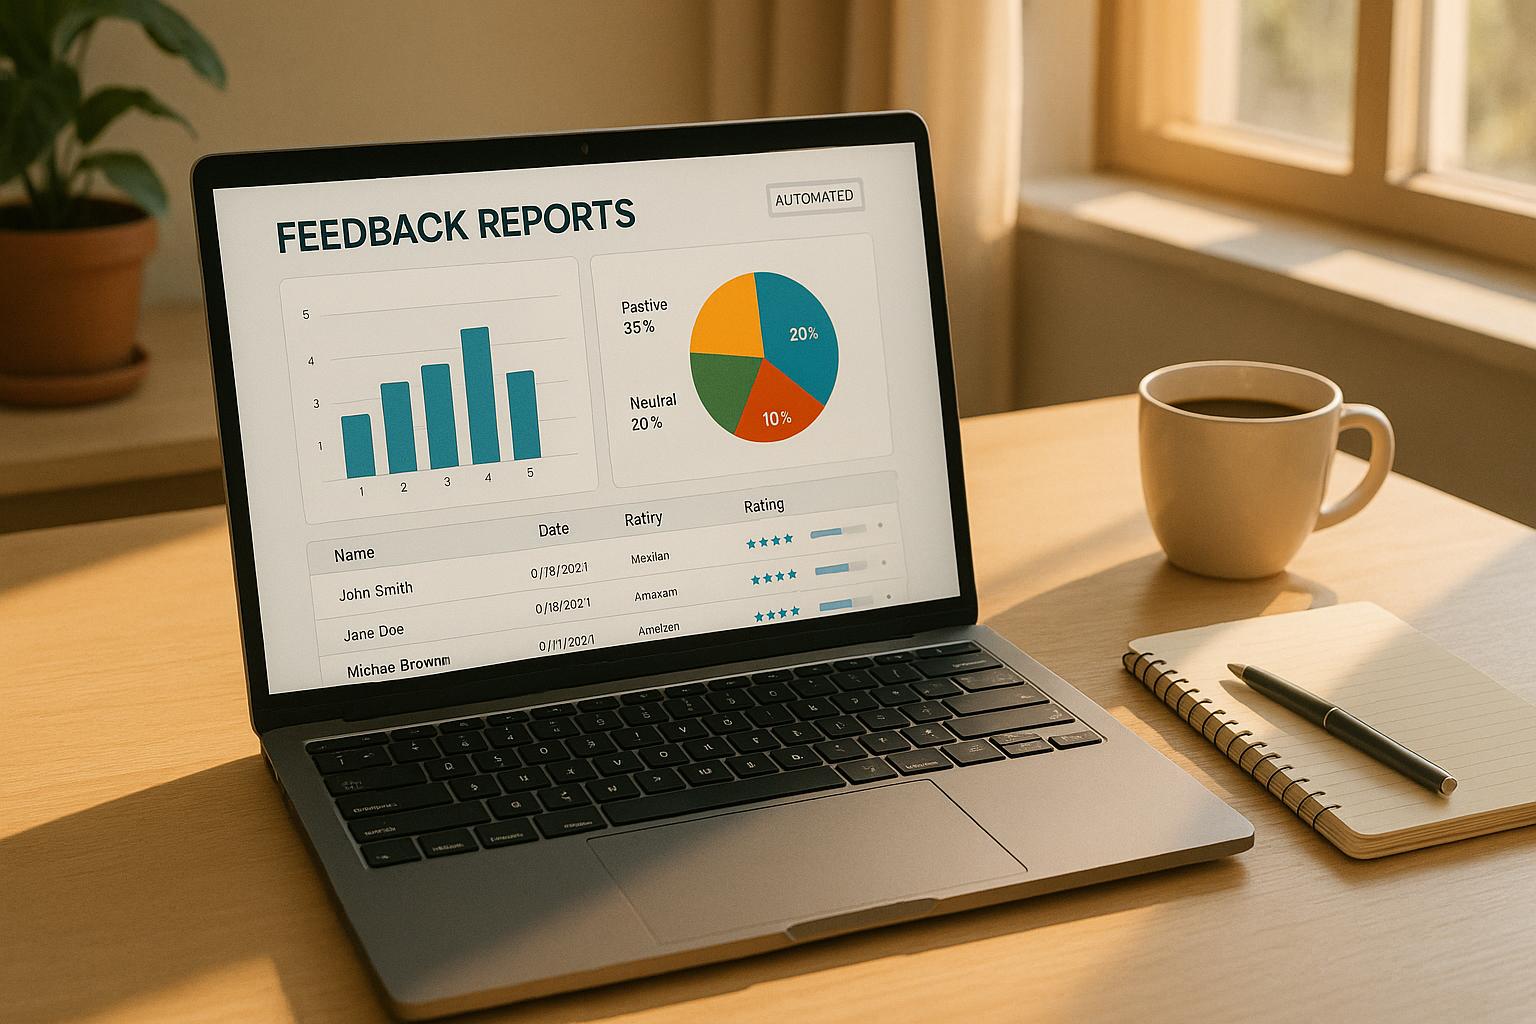
Managing feedback reports manually is time-consuming and prone to errors. Automating this process with no-code tools can save up to 70% of your time, improve accuracy, and ensure faster responses to user concerns. Here's what you need to know:
- No-code tools like Zapier, Typeform, and Airtable let you set up workflows without coding.
- Create feedback forms that are short, mobile-friendly, and easy to embed on your website.
- Automate data processing to sort feedback, analyze sentiment, and generate insights.
- Use visual dashboards to track key metrics like satisfaction scores and trends over time.
- Schedule automated reports to keep your team informed daily, weekly, or monthly.
- Leverage feedback to improve website content, navigation, and user experience.
This guide walks you through setting up feedback automation, from creating forms to building dashboards and acting on insights. Whether you're a business owner or a marketer, no-code tools make it simple to streamline feedback collection and reporting while focusing on what matters most - improving your website.
Build This Product Feedback AI Analyst In Just 10 Minutes | FULL TUTORIAL
Setting Up No-Code Tools for Feedback Collection
Getting your feedback collection system up and running doesn’t have to be complicated. With the right no-code platform, you can start gathering valuable user insights in just a few hours. The key lies in choosing a tool that integrates effortlessly into your existing workflow.
Choosing the Right No-Code Platform
The first step in automating feedback collection is picking a platform that works seamlessly with your website and processes. Integration is critical - look for tools that offer embeddable forms or API support to avoid manual data handling.
Typeform is a standout option for its conversational style, which can boost form completion rates by up to 40% compared to standard forms[2]. Higher completion rates mean more actionable insights to refine your website.
For simpler needs, Google Forms is a reliable, cost-free choice. It integrates directly with Google Sheets, making it easy to manage responses. While it may lack the sleek design of paid tools, it’s perfect for straightforward feedback collection without extra expenses.
Jotform strikes a good balance between usability and advanced features. Its conditional logic allows you to create dynamic forms that adjust based on user input, resulting in more accurate and relevant data.
When selecting a platform, prioritize tools with drag-and-drop interfaces, secure data handling (like encryption and GDPR compliance), and flexible export options (CSV/Excel)[4][2]. Once you’ve chosen a platform, the next step is designing effective feedback forms.
Creating Feedback Forms
Designing feedback forms is all about finding the sweet spot between collecting detailed information and keeping the user experience smooth. Shorter forms tend to perform better - every extra question risks lowering completion rates. Combine closed questions (like multiple choice or rating scales) with open-ended ones to get both quantitative and qualitative insights.
Focus on asking only the most important questions, and consider using progress bars to motivate users to complete the form.
Mobile optimization is a must. Since over 60% of web traffic comes from mobile devices, test your forms on smartphones to ensure they’re easy to use across all screen sizes.
Clear visuals can also improve usability. Use straightforward headings, maintain a logical flow, and stick to consistent styling. Once your form is ready, it’s time to embed it on your site.
Adding Feedback Forms to Your Website
Embedding feedback forms into your Lideroo site is straightforward when using the HTML or JavaScript snippet provided by your platform.
Here’s a typical process:
- Create your form on the platform of your choice.
- Copy the embed code provided.
- Open your Lideroo website editor, add a custom HTML block, and paste the code.
- Position the form to align with your website’s design.
Most platforms offer embedded widgets that ensure your forms look like a natural part of your site.
Placement matters. For example, forms at the end of blog posts are great for capturing feedback from engaged readers, while sidebar forms can gather ongoing input without disrupting the user experience.
Experiment with different placements and track response rates. For directory-style Lideroo sites, consider placing forms on individual listing pages to gather context-specific feedback. Blog-focused sites can benefit from post-specific forms to collect detailed impressions on particular articles or topics.
Building Automated Feedback Reports
Once you've set up a system for collecting feedback, the next step is turning that raw data into meaningful insights. Automated tools make this process seamless by handling everything from data processing to visualization and report distribution, often without needing any coding skills.
Setting Up Automated Data Processing
The first step is creating workflows that process each feedback submission as it comes in. Tools like Zapier, which integrates with over 3,000 apps - including Google Workspace, Slack, Trello, Mailchimp, and Salesforce - make this a breeze[7].
Start by defining triggers based on specific feedback signals. For example, with NPS scores, you can automatically sort responses into three categories: detractors (0–6), passives (7–8), and promoters (9–10). Then, set up actions like opening a support ticket for detractors with an empathetic follow-up email or sending a thank-you message with referral incentives to promoters[3].
For open-ended feedback, natural language processing (NLP) modules step in to classify responses through sentiment analysis and keyword detection[3]. Zapier’s task history feature is particularly useful here, as it lets you monitor your workflows and quickly address any issues before they disrupt your reports[7].
Once processed, the cleaned data flows directly into dashboards, ready for analysis.
Creating Visual Dashboards
Visual dashboards are where raw feedback transforms into clear, actionable insights. These dashboards bring all your data together in one place, making it accessible for everyone on your team[3]. Include elements like NPS breakdowns, sentiment analysis charts, keyword frequency visuals, and time-series graphs to track trends over time, especially in relation to product updates.
Advanced platforms like Sprinklr Insights can take this further by correlating survey feedback with indirect signals - such as social media mentions, online reviews, and customer service interactions. This layered approach ensures your structured survey data aligns with unstructured feedback from other sources[3].
Once your dashboards are up and running, you can automate the delivery of these insights to the people who need them most.
Scheduling Automated Reports
Set your system to send reports on a schedule that works for your team - whether that’s daily at 9:00 AM EST, weekly on Mondays, or monthly on the first of the month[3].
Different teams often need different types of reports. Executives might prefer a monthly overview of high-level trends, product teams could use detailed weekly updates, and customer success teams might rely on daily insights to address pressing issues. For instance, one company improved customer inquiry response times by 47% by automating workflows. Their system created cases, generated support tickets, and sent reminders and alerts to ensure the right people were informed in real-time[3].
To boost collaboration, consider using shared workspaces - like those available through Zapier - where multiple users can build and manage workflows together. This ensures everyone has the tools they need to stay efficient[7]. Additionally, you can customize report delivery by segmenting feedback by type or recipient role. Use integrations like Zapier’s Webhooks to send reports via email, Slack, or directly to dashboard tools[7].
sbb-itb-dfa823a
Using Feedback Data for Website Improvements
Once you've set up automated reports, it's time to turn user feedback into meaningful website improvements. By addressing specific issues raised by users, you can create a more seamless and satisfying experience.
Improving Website Content with Feedback
Feedback shines a light on areas where your site might be falling short - whether that's outdated content, poor navigation, or unclear instructions. If users consistently flag unclear directions, those should go straight to the top of your to-do list.
Take advantage of tools like Lideroo's drag-and-drop editor to make updates quickly and efficiently. For instance, you can refresh your FAQs using Lideroo's pre-built templates and AI-powered tools. This approach ensures your updates not only match your site's design but also directly address user concerns.
To make the process manageable, group feedback into themes like content clarity, navigation, or design. Many no-code tools include tagging and sentiment analysis features to help you spot patterns automatically[4]. If users frequently complain about confusing menus, use Lideroo's features to reorganize them, add breadcrumbs, or include clearer call-to-action buttons.
AI tools can speed up this process even more. With Lideroo's AI-driven content generation, you can draft blog posts, update product descriptions, or create landing page copy based on what users are asking for. Instead of starting from scratch, you can generate a first draft and refine it to align with the feedback you've received.
Companies that actively gather and act on customer feedback can see up to a 25% boost in customer retention rates[3]. This success comes from directly addressing user pain points rather than guessing what needs fixing.
After implementing these updates, use analytics to see how effective they are.
Tracking Changes and Results
Tracking results is key to knowing if your updates are hitting the mark. Lideroo's built-in analytics tools let you measure key metrics before and after making changes based on feedback.
Create custom dashboards to monitor page views, bounce rates, session duration, and conversion rates. If you've reorganized your navigation, for example, look for longer session durations and lower bounce rates - signs that users are finding what they need more easily.
Automated feedback analysis can cut manual reporting time by up to 70%[3].
Set up scheduled reports to keep an eye on these metrics, so you can quickly identify trends and see how specific updates affect user engagement.
Here's a real-world example: A small business directory built on a no-code platform discovered through feedback that users were struggling to find local service providers. By reorganizing categories, adding a search bar, and improving mobile responsiveness, the site owner saw a 30% increase in average session duration and a 20% drop in bounce rates. This clearly showed the changes made a difference.
Keep a detailed log of every update, including the date, description, and reason for the change. This not only supports ongoing improvements but also helps you pinpoint which updates have the biggest impact on user satisfaction.
Combine analytics with continuous user feedback for a well-rounded view. While analytics show what’s happening, user feedback reveals why - and whether your changes are truly solving the right problems.
Best Practices for Feedback Data Analysis
Once you've automated the process of collecting and visualizing feedback, the real work begins - turning that data into actionable insights. Gathering feedback is just the starting point; the real value lies in analyzing it to drive meaningful improvements.
Reading Feedback Data
The first step in analyzing feedback is identifying patterns in your automated reports. Pay close attention to recurring issues. If 5–10% or more of respondents mention the same problem, it likely signals an area that needs immediate attention.
Interactive dashboards are invaluable for transforming raw data into clear visual trends. These tools can highlight how user concerns evolve over time and across different user groups. For example, if complaints about slow loading times spike after a recent update, that’s a clear indicator of where your focus should be. Real-time dashboards also allow your team to monitor these trends as they happen, so you can respond quickly.
Keep in mind that satisfied users are often less vocal, which can skew your data. To balance this, actively seek input from all user segments and set up automated alerts to flag significant changes in key metrics. This ensures you won’t overlook critical issues.
Segmenting users is another powerful way to understand their experiences. For instance, new visitors might struggle with navigation, while long-time users may identify problems with specific features. If you’re using platforms like Lideroo, pay particular attention to feedback about core functionalities like navigation, content accessibility, or monetization tools. These areas directly influence user engagement and, ultimately, revenue.
To avoid biases in your analysis, establish clear criteria before diving into the data. Involve multiple team members to ensure a balanced interpretation, and be cautious of recency bias - recent complaints shouldn’t overshadow long-term trends that might provide a more comprehensive view.
By carefully analyzing this feedback, you can prioritize changes that align with both user needs and business goals.
Making Changes Based on Feedback
Once you’ve identified trends and issues, it’s time to take action. Prioritize improvements systematically, weighing user impact against your business objectives. Tools like an impact-severity matrix can help you rank issues based on how many users are affected and how deeply it impacts their experience. Naturally, high-impact problems affecting a large number of users should be addressed first.
The 80/20 rule is a helpful guideline here: 20% of the issues often cause 80% of user dissatisfaction. Focus on resolving those critical pain points instead of trying to address every minor complaint. Quick fixes can provide immediate relief while you work on larger-scale improvements.
For a more objective approach, consider using a weighted scoring system. Evaluate issues based on factors like user impact, business value, implementation cost, and how well they align with your strategic goals. This method ensures decisions are based on data, not just the loudest complaints.
To get a broader perspective, group feedback into themes such as navigation, design, or clarity using tagging and sentiment analysis. For example, if users frequently mention confusing menus, you could use Lideroo’s drag-and-drop editor to simplify navigation, add breadcrumbs, or create more intuitive call-to-action buttons.
A/B testing is essential for validating your changes. It removes guesswork and helps you see exactly which updates deliver the best outcomes.
Keep track of every change in a detailed change log, noting the date, description, and reasoning behind each update. This record not only builds organizational knowledge but also helps your team understand what works best for improving user satisfaction. Real-time collaboration tools can further streamline this process, allowing teams to align on priorities and share updates easily. Regularly reviewing reports with stakeholders ensures everyone stays informed about progress and next steps.
Finally, remember that correlation doesn’t always mean causation. Test your hypotheses thoroughly before making major changes. For example, if bounce rates increase after a design update, consider other factors like seasonal trends or external events that might be influencing the data. This careful approach ensures your solutions are both effective and well-informed.
Conclusion
Automating feedback reports can transform how businesses handle data collection, analysis, and follow-up actions. By removing the need for manual data compilation, automating dashboards, and scheduling reports - all without requiring coding skills - companies can save significant time and resources [4]. These systems are quick to implement, often taking just a few hours to set up [1].
The process revolves around three key steps: creating feedback collection forms, linking data sources to reporting platforms, and setting up automated workflows. Together, these steps create a streamlined system that supports growth and scalability [2]. With over 65% of businesses now using no-code tools for workflow automation, adopting automated feedback systems has become a critical move to stay competitive [6]. For Lideroo users, this means gaining real-time insights that drive continuous improvement.
Lideroo users, in particular, are well-positioned to take advantage of these automated workflows. The platform’s drag-and-drop editor makes embedding feedback forms easy, even for those without technical expertise. Its built-in user management tools also help track satisfaction and engagement metrics over time. For directory websites built on Lideroo, automated feedback collection can identify top-performing listings and highlight areas where users want improvements. Additionally, the platform’s monetization tools can reveal which premium features or subscription options resonate most with users, enabling smarter decisions about pricing and feature development.
The benefits are clear. Businesses using automated feedback reporting often see a 25% increase in actionable insights and can address customer concerns in real time, avoiding delays caused by manual reporting [6][5]. For Lideroo users, this means faster updates, better user retention, and higher conversions for premium subscriptions - all driven by actual user feedback.
To get started, try a small pilot project. Focus on one feedback source and one automated report. Choose tools that integrate seamlessly with your current setup and prioritize strong security. Build workflows that turn feedback into measurable improvements, setting the stage for long-term growth and success.
FAQs
How can no-code tools streamline feedback collection and reporting?
No-code tools like Zapier and Typeform simplify the process of collecting and managing feedback by fitting right into your current workflows. For instance, you can design intuitive feedback forms with Typeform, and then use Zapier to automatically route responses to platforms like Google Sheets, Slack, or even email for instant updates.
These tools remove the hassle of manual data entry. You can set up triggers and actions to handle tasks like creating visual dashboards or sending follow-up emails. The result? You save time, minimize errors, and keep feedback organized and ready to act on.
What are the best practices for creating feedback forms that encourage more responses?
To create feedback forms that people actually want to fill out, focus on simplicity and ease of use. Stick to clear, straightforward language and skip any questions that aren't absolutely necessary. Start with a few quick, easy questions to get the ball rolling, and mix in both multiple-choice and open-ended formats to gather a range of insights.
Make sure your form works seamlessly on any device and takes just a few minutes to complete. Sweeten the deal by offering an incentive - like a discount or a chance to win something - which can boost participation. Lastly, keep the design clean, visually appealing, and aligned with your brand to leave a polished impression.
How can businesses use automated feedback reports to improve their websites and enhance user experience?
Automated feedback reports are a powerful way for businesses to pinpoint areas of their website that could use some fine-tuning. By gathering and analyzing user feedback efficiently, these reports can reveal patterns in behavior, highlight common frustrations, and uncover opportunities to make meaningful improvements.
Using no-code tools to automate this process can be a game-changer. It frees up time while delivering actionable insights. For instance, visual dashboards created from feedback data can make it simple to identify trends and prioritize updates. Whether it’s enhancing navigation, resolving technical glitches, or polishing content, these insights can drive a better user experience.